Equity Markets Surge in the First Half of 2024
In our January CIO Newsletter titled “A Soft Landing Comes into Focus,” we discussed the banner year that equity markets had in 2023 as inflation showed continued signs of progress, the economy hummed, the employment picture remained favorable, and corporate earnings estimates were being revised higher. Fast forward to July 2024, and we’re likely experiencing the soft landing as we speak, and markets expect the Fed will nail the dismount. We’ll discuss within.
U.S. equities rallied sharply in the first half of the year, continuing the strong momentum from 2023 powered by Mega-Cap technology stocks and those in the Artificial Intelligence (AI) limelight. The S&P 500 rose +15.3% through June 30, with the majority of those returns coming from only a handful of stocks. Specifically, the “Magnificent 7” (“Mag 7”), collectively Apple, Microsoft, Nvidia, Meta, Alphabet, Amazon, and Tesla returned +37% during the first half of the year, according to Bloomberg data. Nvidia alone was responsible for nearly half of that. For comparison, the Mag 7 returned +76% in 2023, representing 63% of the S&P 500’s return last year.
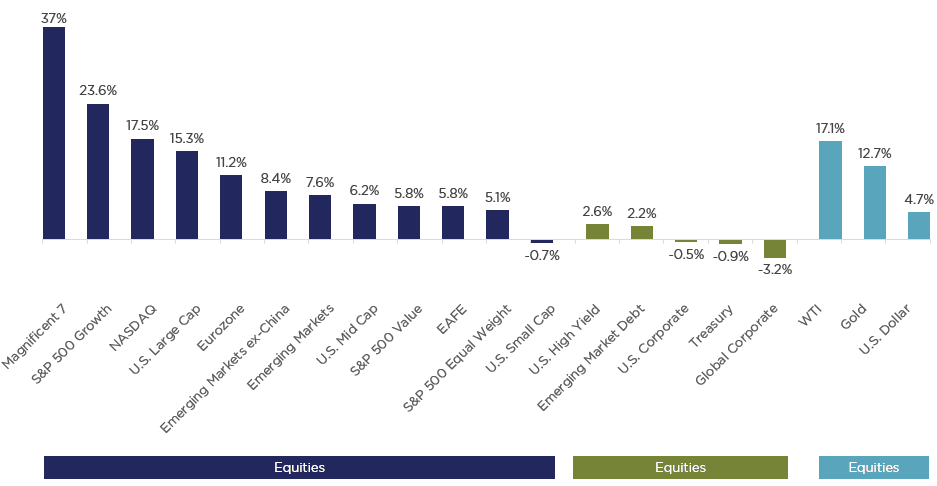

Put differently, the remaining 493 stocks have had a lackluster 18-months, contributing a mere 8% of the S&P 500’s +26.3% return in 2023, and 5% of the YTD return. Whether it’s the S&P 493, or the Mid- and Small-Cap stocks, investors have been rewarded over the past year-and-a-half for concentration risk in the Mag 7; however, that may be about to change.
Looking “down-cap” to the average stock, the S&P 500 Equal Weight Index returned +5.1% YTD, the widest gap between the market-cap weighted index for the first half of a year since 1990 (-10.2%), according to Dow Jones. Extrapolating further to Mid- and Small-Cap’s, the S&P 400 and S&P 600 returned +6.2% and -0.3% YTD, again handily underperforming the broad S&P 500 Index. We’ve written extensively on the attractiveness of Mid- and Small-Caps on multiple metrics and through various lenses, and continue to believe that to be the case. As market concentration grows, a rotation into the “rest” of the market ex-Mag 7 could be powerful – we saw that in full-force during November and December 2023 as interest rates fell, rate cut expectations rose, and Mid- and Small-Cap’s surged in price. A similar trend may be under way this month (July) on the back of a softer than expected Consumer Price Index (CPI) print for June, which caused a downshift in interest rates, and the market priced in a near 100% probability of a September rate cut. Again, Small- and Mid-Caps surged, and as we go to press are handily outperforming Large-Caps on the month. Stay tuned for our August Monthly Market Wrap for more.
We continue to believe as air comes out of the AI trade, investors will rotate into more attractively valued parts of the market like the “average” stock, and most notably Mid- and Small-Caps. As we go to press, the Small-Cap S&P 600 Index just hit a new 52-week high on July 29, with signs of the rotation just beginning.
Market Concentration
As we wrote about in the July Monthly Market Wrap, market concentration remains a significant risk to equity investors.According to J.P. Morgan, the Top 10 holdings in the S&P 500 represented 37.1% of the S&P 500’s market capitalization at the end of the quarter, up from 32.1% on December 31, 2023. That dwarfs the mid-20’s percent concentration back during the Dot-Com bubble. What’s more, the S&P 500 briefly had three companies (Apple, Microsoft, & Nvidia) worth more than $3 Trillion in market-capitalization each, representing more than 21% of the S&P 500 when combined. As of July 30, those same three companies represent more than 19% of the S&P 500 Index. For comparison, the market cap of Apple ($3.4 Trillion) is greater than the market capitalization of the United Kingdom ($3.3 Trillion).
What’s more, according to MSCI, these same companies propelled the collective weight of all U.S. listed stocks to 64% of the MSCI All-Country World Index (the global investable universe) at quarter end, a record high. Dissecting that further to just developed economies (removing Emerging Markets, and notably China), U.S. companies represented 72.1% of the MSCI World Index of developed market companies. Lastly, it’s interesting to note that the Top 10 holdings of MSCI World are the same Top 10 holdings within the S&P 500 Index, and represent 24.6% of the world’s market capitalization – no international company makes the cut.
Collectively, these figures point to the dominance of U.S. markets, specifically U.S. Large-Cap Growth, when compared to just about everything else. The problem now is not only are markets concentrated, pockets of the AI basket look expensive – some significantly so. At quarter end, the Top 10 holdings in the S&P 500 traded at an average next twelve-month price to earnings (NTM P/E) ratio of 30.3x according to JP Morgan, or 148% of their 20.4x average in data going back to 1996. Within that cohort, Nvidia, Microsoft, and Apple (the Top 3) have seen their valuations expand meaningfully on AI hopes for the future, and earnings have yet to keep up. Some investors now question when, or if, companies investing heavily in AI infrastructure (i.e. chips and data centers) will earn sufficient return on that investment.
Within the infrastructure cohort, Nvidia cannot crank out their graphics processing unit (GPU) chips quick enough, and Mega-Cap tech cannot buy them fast enough. On their most recent conference call, executives at Alphabet (Google) discussed a preference for overinvestment than underinvestment. The collective bias continues to be for more, not less, in the AI infrastructure arms race. While we’re likely still in Phase 1 or 2 of the AI transformation, it remains to be seen when AI will broaden out into mass adoption and translate into increased corporate profits in other parts of the market. Perhaps the profits timeline is further in the future than previously thought, opening the possibility for a rotation out of the AI theme and into the rest of the market as described above.
Analyzing a Soft Landing
With the Fed’s dual mandate in focus, substantial progress continues to be made on both fronts, namely price stability and full employment. A key question our Investment Committee regularly discusses is “What does a soft landing actually look like?” The prevailing answer looks and feels like the current state of the U.S. economy – namely falling inflation, a softening labor market, and slowing economic growth – all evident today. Back in January we wrote about looking for a “smoking gun” as evidence that something sinister taking place. We’ve yet to find one.
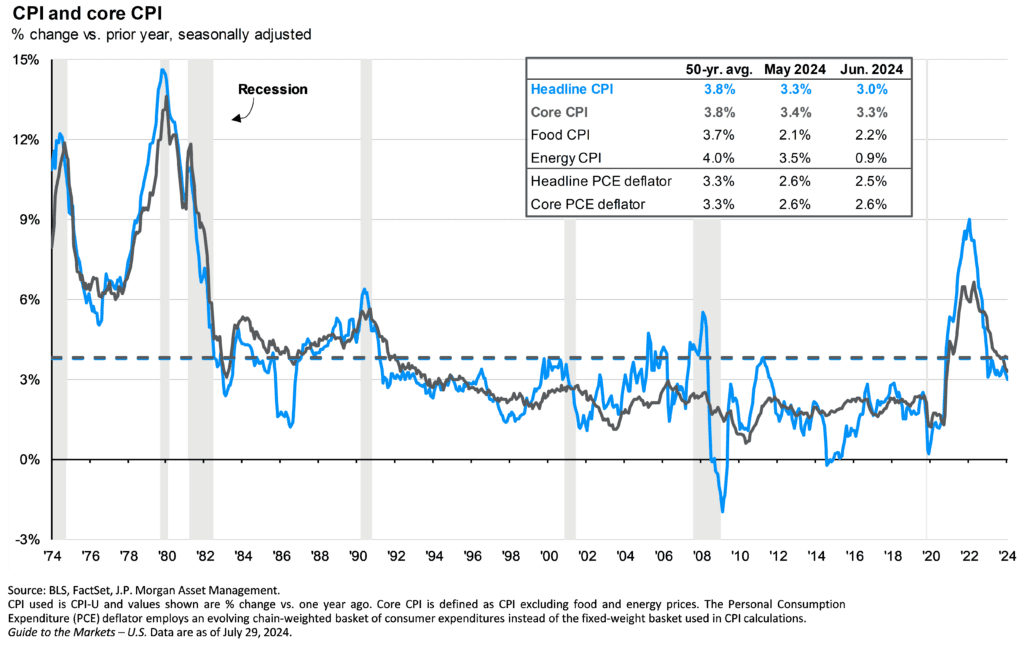
- Inflation continues to fall, as evidenced by the nearby chart. June’s reading of the CPI showed inflation coming in below expectations, falling -0.1% month over month to 3.0% on a year over year basis. Looking at the Fed’s preferred gauge of inflation, the Personal Consumption Expenditure (PCE) Index, headline PCE was 2.5% in June, close to the Fed’s 2% inflation target.
- The labor market continues to show signs of softening, without meaningful signs of stress. The U.S. economy added +206,000 non-farm jobs in June, down from +272,000 in May. Headline unemployment rose to 4.1%, snapping a 34-month streak of at or below 4% unemployment. Wage growth continues to slow, as fewer workers quit their jobs. The Job Opening to Labor Turnover Survey (JOLTS) continues to show fewer job openings present in the economy, falling from 12.2 million job openings in March 2022, to 8.1 million in April 2024, the latest data point available. April’s read represents a near return to pre-pandemic levels. As people do move jobs, their previous positions are not always being replaced, contributing to less stress on the labor market today than a year ago. Lastly, as a forward-looking indicator, the latest read on initial jobless claims came in at 235K on July 25, not showing signs of stress. Even Fed Chair Powell recently noted that “the labor market appears to be fully back in balance”.
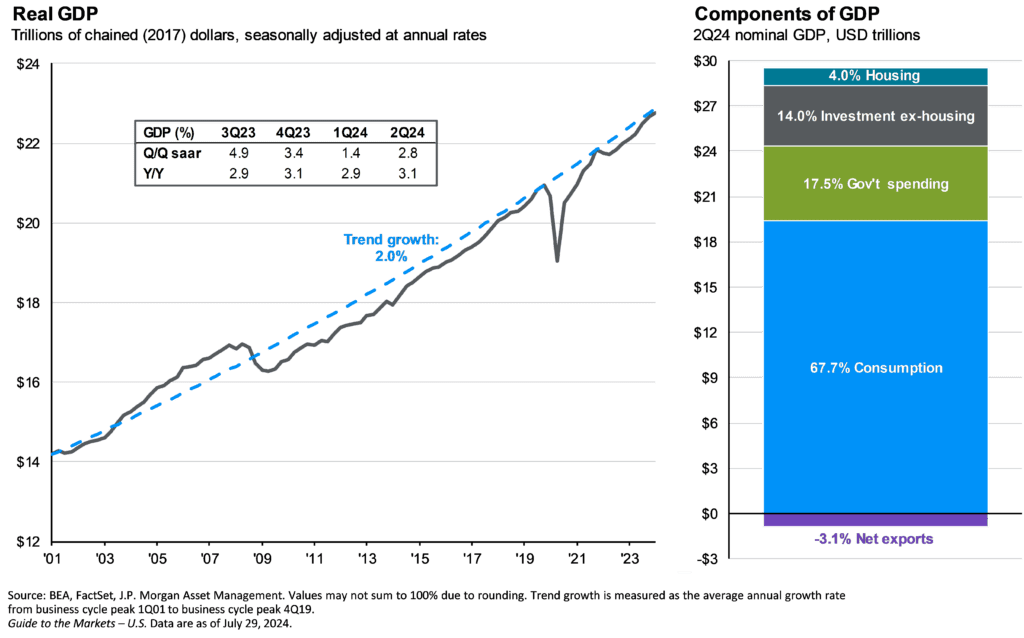
- The U.S. economy has continued to grow, and even accelerated in the second quarter, as inflation moderated and the unemployment picture rebalanced. GDP clocked in at +2.8% in Q2, ahead of expectations for +1.9% growth, and an uptick from the +2.0% growth rate seen in Q1. Thinking about GDP in the 2% range would largely be synonymous with trend growth, or the economy growing at or near its potential. As seen by the nearby chart, the U.S. economy is powered by the consumer, representing nearly 70% of GDP. Recent retail sales data has remained robust, rising +0.3% Y/Y in June, ahead of expectations for a -0.4% decline. Under the surface, companies are reporting that consumers being more discerning on their spending. Perhaps not changing the aggregate amount of spending, but how and where they spend those dollars. Whether we are talking about the high-end consumer (i.e. Louis Vuitton), or average consumer (i.e. Starbucks or McDonalds), recent earnings reports show behaviors shifting. Signs of aggregate spending slowing or declining would be a cautioning sign for economic growth ahead.
- Pivoting to the financial economy (i.e. the equity markets), corporate earnings have continued to grow, with estimates for 2025 earnings continuing to increase (From $275 at time of our January publication to $279 today). Many companies have raised their guidance for next year, not something we would expect if a hard landing was evident. Earnings have largely come in above expectations dating back to last year. Taken together, we’re seeing the Fed’s dual mandate of price stability and full employment trending in the right direction. As of July 26th, the Atlanta Fed GDPNow model estimate of real GDP growth in Q3 is 2.8%, underscoring economic growth that remains near or above trend, not grinding to a halt.
What Does the Fed Do?
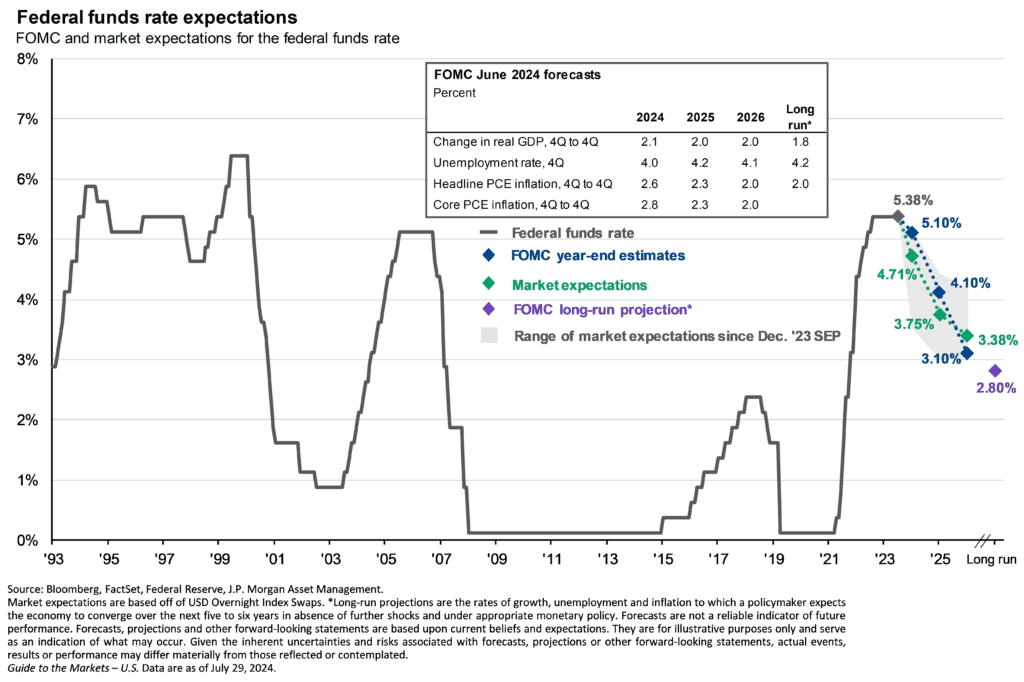
It has officially been a full year since the Fed last raised interest rates. Hard to believe it was that long ago (July 22, 2023), but as the Fed gears up for a future rate cutting cycle, it is important to assess the implications across asset classes, and the overall economy. Continued signs of benign inflation within the context of a soft landing should allow the Fed to start cutting rates, and potentially signal as much at their July meeting. While markets are currently pricing in a September rate cut, the Fed could signal its intentions when they meet this week. A Fed that signals rate cuts are coming could add fuel to the rotational fire that has seen the market broaden out, favoring Small-Caps and the rest of the market that is not the Mag 7 (less likely to benefit from rate cuts).
An Opportune Time to Diversify
As mentioned earlier, concentration risk is real, and investors may benefit from diversifying their holdings into parts of the market with less market concentration or that have lagged. Many of these areas look attractively valued, notably the S&P 493, U.S. Mid- and Small-Caps, and both International and Emerging Markets. While we’ve made the case for Small- and Mid-Caps, here are additional opportunities that look attractive:
- International equities have underperformed their U.S. counterparts for most of the past decade. Through June 30, Developed Markets (MSCI EAFE Index) rose +5.8%, while Emerging Markets (MSCI EM Index) gained +7.6%. International stocks in general have been hamstrung by the lack of growth companies found within their borders, as well as slower earnings growth when compared to domestic equities. More importantly, current valuations are supportive and encouraging for international equities. NTM P/E ratios for the MSCI ACWI ex-USA Index, representing both international Developed and Emerging Markets, currently trades at a -36% discount to the S&P 500 Index, the widest in 20 years. The same goes for the starting dividend yield of international stocks, starting at a 3.1% yield, more than double the dividend yield of the S&P 500 Index. The gap (+1.7%) in yields is also at a 20 year wide. Both metrics are significant, at more than two standard deviations from their long-term averages, and represent attractive starting points for investors.
- Fixed Income continues to look attractive within the investment grade landscape. Treasury yields have come down, but remain elevated compared to the past 15 years. The benchmark 10-year Treasury bond yielded 4.34% as of quarter end, up +48bps from the closing yield at the end of December, but down from April. Corporate credit spreads remain tight (i.e. expensive) and we continue to find relative value in the securitized (i.e. ABS: Asset Backed Securities and MBS: Mortgage Backed Securities) and the structured credit markets (i.e. CLOs: Collateralized Loan Obligations). These corners of the market are a bit less traveled, but offer relative value for investors, with yields between 5-7% for investment grade credit quality.
- Equity income replacements such as Utilities, Healthcare and Global Infrastructure offer a lower volatility way to add defensive equity exposure and higher yields and attractive valuations. We’ve recently added positions in these sectors to our portfolios. High dividend payers and growers could also be options. Most dividend and income related strategies have lagged the market over the past year, meaning investors have not necessarily “missed out”, offering attractive ways to invest cash that may be on the sidelines, or from maturing instruments.
For those investors still heavily invested in cash or equivalents (i.e. CD’s, high yield savings accounts) now may be the time to consider moving into other parts of the market. Markets have already started to price in rate cuts later this year. That has sent the yield on the 12-month Treasury Bill below 5%, while the target for Fed Funds remains 5.25-5.50%. What’s more, the 2-year Treasury note currently yields less than 4.4%, more than 100bps below current policy rates, signaling market expectations for lower rates in the future.
On the horizon, plenty of risks remain. Elevated government deficits, global elections, and ample geopolitical concerns await. Establishment parties globally are facing an uprising, case in point Narendra Modi in India and Emmanuel Macron in France. While both barely held on to power, it was by coalition force, with both of their respective parties weakened in the polls. The Labour Party in the United Kingdom had an overwhelming tsunami to usher in a new government. Bottom line, citizens are voting against the current regimes globally after years of inflation has eroded purchasing power leaving many questioning whether they’re better off now than they were just a few years ago. A continued focus on risk management and diversification should help weather any impending storms. Ensuring an accurate asset allocation may provide the best benefit of all – peace of mind.
Thank you for your continued support of Nottingham Advisors and trust in our Team. If you’d like to review your portfolio together or discuss our investment outlook, please give us a call.
We would love to hear from you.

Matthew Krajna, CFA
Co-Chief Investment Officer
Matthew joined Nottingham in 2012 and is a member of the Investment Policy Committee. He brings over 13 years of investment experience to the team. Matthew is responsible for conducting investment research, due diligence, and contributing to Nottingham Advisors overall investment strategy. Additionally, He is responsible for establishing the firm’s strategic and tactical asset allocations. Matthew works with investment advisors and both individual clients & institutions to help build customized investment solutions to fit their needs.
Nottingham Advisors offers both institutional and individual clients experience, sophistication, and professionalism when helping them achieve their goals. With over 40 years of serving Western New York and clients in more than 30 states, Nottingham tailors each solution to fit the specific needs of each client.
For more information about Nottingham’s offerings, visit www.nottinghamadvisors.com or call 716-633-3800.
Nottingham Advisors, Inc. (“Nottingham”) is an SEC registered investment adviser located in Amherst, New York. Registration does not imply a certain level of skill or training. Nottingham and its representatives are in compliance with the current registration and notice filing requirements imposed upon SEC registered investment advisers by those states in which Nottingham maintains clients. Nottingham may only transact business in those states in which it is registered, notice filed, or qualifies for an exemption or exclusion from registration or notice filing requirements. For information pertaining to the registration status of Nottingham, please contact Nottingham or refer to the Investment Advisor Public Disclosure Website (www.adviserinfo.sec.gov). Any subsequent, direct communication by Nottingham with a prospective client shall be conducted by a representative that is either registered or qualifies for an exemption or exclusion from registration in the state where the prospective client resides.
This newsletter is limited to the dissemination of general information pertaining to Nottingham’s investment advisory services. As such nothing herein should be construed as the provision of personalized investment advice. The information contained herein is based upon certain assumptions, theories and principles that do not completely or accurately reflect your specific circumstances. Information presented herein is subject to change without notice and should not be considered as a solicitation to buy or sell any security. Adhering to the assumptions, theories and principles serving the basis for the information contained herein should not be interpreted to provide a guarantee of future performance or a guarantee of achieving overall financial objectives. As investment returns, inflation, taxes and other economic conditions vary, your actual results may vary significantly. Furthermore, this newsletter contains certain forward-looking statements that indicate future possibilities. Due to known and unknown risks, other uncertainties and factors, actual results may differ materially from the expectations portrayed in such forward-looking statements. Readers are cautioned not to place undue reliance on forward-looking statements, which speak only as of their dates. As such, there is no guarantee that the views and opinions expressed in this article will come to pass. This newsletter should not be construed to limit or otherwise restrict Nottingham’s investment decisions.
This newsletter contains information derived from third party sources. Although we believe these third party sources to be reliable, we make no representations as to the accuracy or completeness of any information prepared by any unaffiliated third party incorporated herein, and take no responsibility therefore. Some portions of this newsletter include the use of charts or graphs. These are intended as visual aids only, and in no way should any client or prospective client interpret these visual aids as a method by which investment decisions should be made. We have provided performance results of certain market indices for illustrative purposes only as it is not possible to directly invest in an index. Indices are unmanaged, hypothetical vehicles that serve as market indicators and do not account for the deduction of management fees or transaction costs generally associated with investable products, which otherwise have the effect of reducing the performance of an actual investment portfolio. It should not be assumed that your account performance or the volatility of any securities held in your account will correspond directly to any benchmark index. A description of each index is available from us upon request.
Investing in the stock market involves gains and losses and may not be suitable for all investors. Past performance is no guarantee of future results.
For additional information about Nottingham, including fees and services, send for our Disclosure Brochure, Part 2A or Wrap Brochure, Part 2A Appendix 1 of our Form ADV using the contact information herein.