

Markets Rebound Sharply in the First Half
Equity markets rebounded sharply in the first half of the year as inflation cooled and the labor market remained strong. Coming off of the worst year since 2008, valuations corrected sharply in 2022, and have expanded in 2023 as fundamental underpinnings for global markets stabilized, and in the case of the US, accelerated into quarter end.
To recap, the S&P 500 rose +16.9% through June 30, followed by Mid- and Small-Caps, as measured by the S&P 400 & 600 Indices, which rose +8.8% and +6.0%, respectively. Performance was exceptionally strong in the month of June, where Mid-, Small-, and Large-Caps rose +9.2%, +8.2%, and +6.6%, respectively on the back of stronger than expected economic data and downward inflation surprises. The data thus far continues to underscore the resilience of the US economy and defy skeptics who believed a recession was imminent in the first half of the year.
While equities have rallied significantly in the first half, it has largely been driven by a handful of Mega-Cap stocks, including Apple (+49.7%), Microsoft (+42.7%), Alphabet (+36.3%), Amazon (+55.2%), Meta (+138.5%), Tesla (+112.5%), and NVIDIA (+189.5%), all beneficiaries from the Artificial Intelligence (AI) boom that has taken the market by storm. Looking at the S&P 500 on an equal weighted basis, the market is only up +5.5% year to date. The top heaviness of the market has propelled the S&P 500 Growth Index +21.4% so far this year, well ahead of the S&P 500 Value Index, which has gained a still respectable +12.1%. At the sector level, 4 of 11 sectors remain in the red for the year (Utilities, -5.7%; Energy, -5.6%; Healthcare, -1.5%; and Financials, -0.5%), and an additional 4 of 11 sectors that have posted positive gains, but lagged the overall market (Industrials +10.2%; Materials, +7.7%; Real Estate, +3.7%; and Consumer Staples, +1.3%). That leaves Technology (+42.8%), Communication Services (+36.2%), and Consumer Discretionary (+33.0%) as the only sectors outperforming the market. It should come as no surprise that these three sectors are home to the seven Mega-Cap stocks outlined above.
International markets rose in tandem, with both Developed and Emerging Markets posting positive gains through the end of the second quarter. Developed Markets, as measured by the MSCI EAFE Index rose +12.2%, while Emerging Markets (EM), as measured by the MSCI EM Index, rose +5.0%. Emerging Markets have been weighed down by their heavy exposure to China, which stood at nearly one-third of the index at quarter end. Chinese equities, as measured by the MSCI China Index, lost -5.0% through June 30, the mirror image of the broader EM Index. Put differently, the MSCI Emerging Markets ex-China Index, is up +9.9% year to date, thanks to a heavier reliance on Taiwan, South Korea, and India, and no direct exposure to China. Chinese data has continued to weaken as we go to press, as the reopening post-COVID has fizzled, and a lack of stimulus has dampened consumption. This in turn has put downward pressure on inflation, and may lead to increased deflationary pressures in the medium-term. Add in a 20%+ youth unemployment rate and rising tensions with the West, and the outlook gets murkier. US imports from China hit their lowest level since 2005, according to May data from the US Census Bureau, underscoring the issues plaguing China.
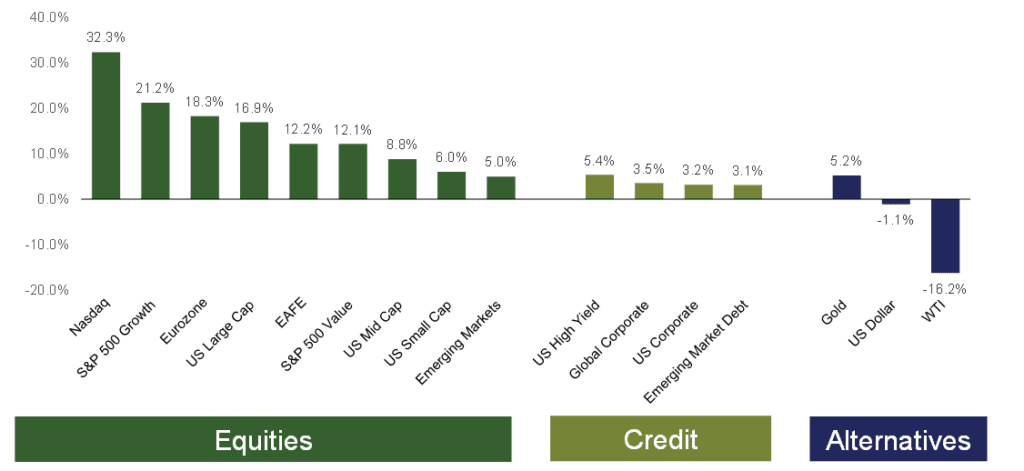
All Returns 1/1/2023 – 06/30/2023
Bonds posted positive returns across the board as yields declined on the back of better than expected inflation prints, and a Fed “skip” at its June meeting. Long-term Treasury yields ended the quarter lower than the start of the year, as each of the 10YR, 20YR, and 30YR Treasuries rose in price. The broad Bloomberg Barclays US Government Index gained +1.6% year to date, while the Bloomberg Barclays Municipal Index gained +2.7%. Better than expected economic data buoyed credit exposures, as the Bloomberg Barclays US Corporate Index rose +3.2% and the Bloomberg Barclays US Corporate High Yield Index rose +5.4%. Given the significant rise in interest rates over the past year, the starting point for investors today (in terms of starting yield) looks favorable. Rates are near their highest levels in more than a decade, offering investors the opportunity to achieve 4%+ yields to maturity across much of the investable universe.
To read the full paper, download the newsletter below.

Matthew Krajna, CFA
Co-Chief Investment Officer
Matthew joined Nottingham in 2012 and is a member of the Investment Policy Committee. He brings over 13 years of investment experience to the team. Matthew is responsible for conducting investment research, due diligence, and contributing to Nottingham Advisors overall investment strategy. Additionally, He is responsible for establishing the firm’s strategic and tactical asset allocations. Matthew works with investment advisors and both individual clients & institutions to help build customized investment solutions to fit their needs.
Nottingham Advisors offers both institutional and individual clients experience, sophistication, and professionalism when helping them achieve their goals. With over 40 years of serving Western New York and clients in more than 30 states, Nottingham tailors each solution to fit the specific needs of each client.
For more information about Nottingham’s offerings, visit www.nottinghamadvisors.com or call 716-633-3800.
Nottingham Advisors, LLC (“Nottingham”) is an SEC registered investment adviser located in Amherst, New York. Registration does not imply a certain level of skill or training. Nottingham and its representatives are in compliance with the current registration and notice filing requirements imposed upon SEC registered investment advisers by those states in which Nottingham maintains clients. Nottingham may only transact business in those states in which it is registered, notice filed, or qualifies for an exemption or exclusion from registration or notice filing requirements. For information pertaining to the registration status of Nottingham, please contact Nottingham or refer to the Investment Advisor Public Disclosure Website (www.adviserinfo.sec.gov). Any subsequent, direct communication by Nottingham with a prospective client shall be conducted by a representative that is either registered or qualifies for an exemption or exclusion from registration in the state where the prospective client resides.
This newsletter is limited to the dissemination of general information pertaining to Nottingham’s investment advisory services. As such nothing herein should be construed as the provision of personalized investment advice. The information contained herein is based upon certain assumptions, theories and principles that do not completely or accurately reflect your specific circumstances. Information presented herein is subject to change without notice and should not be considered as a solicitation to buy or sell any security. Adhering to the assumptions, theories and principles serving the basis for the information contained herein should not be interpreted to provide a guarantee of future performance or a guarantee of achieving overall financial objectives. As investment returns, inflation, taxes and other economic conditions vary, your actual results may vary significantly. Furthermore, this newsletter contains certain forward-looking statements that indicate future possibilities. Due to known and unknown risks, other uncertainties and factors, actual results may differ materially from the expectations portrayed in such forward-looking statements. Readers are cautioned not to place undue reliance on forward-looking statements, which speak only as of their dates. As such, there is no guarantee that the views and opinions expressed in this article will come to pass. This newsletter should not be construed to limit or otherwise restrict Nottingham’s investment decisions.
This newsletter contains information derived from third party sources. Although we believe these third party sources to be reliable, we make no representations as to the accuracy or completeness of any information prepared by any unaffiliated third party incorporated herein, and take no responsibility therefore. Some portions of this newsletter include the use of charts or graphs. These are intended as visual aids only, and in no way should any client or prospective client interpret these visual aids as a method by which investment decisions should be made. We have provided performance results of certain market indices for illustrative purposes only as it is not possible to directly invest in an index. Indices are unmanaged, hypothetical vehicles that serve as market indicators and do not account for the deduction of management fees or transaction costs generally associated with investable products, which otherwise have the effect of reducing the performance of an actual investment portfolio. It should not be assumed that your account performance or the volatility of any securities held in your account will correspond directly to any benchmark index. A description of each index is available from us upon request.
Investing in the stock market involves gains and losses and may not be suitable for all investors. Past performance is no guarantee of future results.
For additional information about Nottingham, including fees and services, send for our Disclosure Brochure, Part 2A or Wrap Brochure, Part 2A Appendix 1 of our Form ADV using the contact information herein.