

Equity Markets Post Banner 2023
Equity markets surged in the fourth quarter to cap off a banner year for nearly all major market asset classes. Inflation continued on its downward trajectory, and the labor market remained resilient. Earnings for S&P 500 companies grew in the back half of the year, and expectations for continued growth in 2024 & 2025 remain consensus expectations. GDP accelerated into year end, defying market forecasters calling for an imminent recession. The soft landing we’ve been planning for is now in focus, and the Federal Reserve believes it too. Taken together, market expectations are high – both for continued earnings growth (which underpins current valuations) and for the Federal Reserve to sharply cut interest rates (more on this in a bit).
To recap, the S&P 500 rose +26.3% in 2023, followed by Mid- and Small-Caps, as measured by the S&P 400 & 600 Indices, which rose +16.4% and +15.9%, respectively. Performance was remarkably strong in the month of December, with Small-, Mid-, and Large-Caps adding +12.8%, +8.7%, and +4.5%, respectively. For the fourth quarter, Small-, Mid-, and Large-Caps rose +15.1%, +11.7%, and +11.7%, respectively, as interest rates fell from their October highs. The benchmark 10-year Treasury yield fell from an intra-day high above 5% in October to below 4% in December. In early November, Treasury Secretary Janet Yellen’s comments on lower than expected Treasury issuance accelerated the decline. Fed Chair Jay Powell’s dovish tone at December’s Federal Open Market Committee (FOMC) meeting and projection for 3-4 rate cuts in 2024 added fuel to the fire. Markets raced to re-price both equity and fixed income securities on the news.
The equity rally was largely driven by the “Magnificent 7”, namely Apple (+49.0%), Microsoft (+58.2%), Alphabet (+58.8%), Amazon (+80.9%), NVIDIA (+239.0%), Meta (+194.1%), and Tesla (+101.7%), all beneficiaries from Artificial Intelligence (AI) and lower interest rates. As a whole, the Mag 7 returned +107.0% in 2023, versus only +13.9% for the “average” stock, as measured by the S&P 500 Equal Weight Index.
International markets also rose, with both Developed and Emerging Markets posting positive returns. Developed Markets, as measured by the MSCI EAFE Index rose +19.0%, while Emerging Markets (EM), as measured by the MSCI EM Index, rose +10.1% on the year. Emerging Markets continued to be weighed down by heavy exposure to China, as the MSCI China Index fell -11.0% on the year. In contrast, the MSCI Emerging Markets ex-China Index rose +20.0%, thanks to heavier exposures to countries such as Taiwan and India. Taken together, China’s weight in the EM index now stands below 25%, whereas it was nearly one-third of the benchmark just a year ago.
The Chinese economy remains stuck in a post-COVID rut. Consumer spending is weak, and youth unemployment is above 20%. The property market, long a store (and source) of wealth, is wobbling. Demographics are unfavorable, with an aging and declining population. As we go to press, news of a stimulus package may be too little too late. Only time will tell, but the US and Chinese economies look to be on vastly different courses – which could intensify geopolitical tensions.
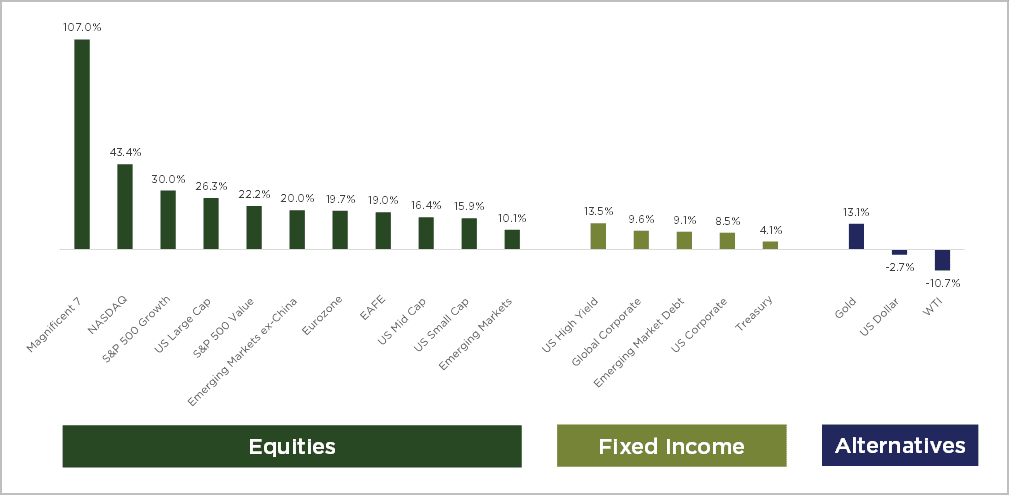
Returns in US Dollars. Indices used are as follows: Magnificent 7: Bloomberg Magnificent 7 total Return Index: Nasdaq: Nasdaq Composite Index; S&P 500 Growth: S&P 500/Citgroup Growth Index; Eurozone: MSCI EMU Index; U.S. Large-Cap: S&P 500 Index; EAFE: MSCI EAFE Index; S&P 500 Value: S&P 500/Citigroup Value Index; US Mid Cap: S&P 400 Index; US Small Cap: S&P 600 Index; Emerging Markets: MSCI EM Index; Emerging Markets ex-China: MSCI Emerging Markets ex-China Index; Treasury: Bloomberg Barclays US Government Index; US High Yield: Bloomberg Barclays US Corporate High Yield Index; Global Corporate: Bloomberg Global Agg Corporate Total US Dollar: BBDXY; WTI: Bloomberg ‘CL1 Comdty’
All Returns 1/1/2023 – 12/31/2023
Fed Rate Cut Expectations Propel Bond Market
At its December meeting, the FOMC again left interest rates unchanged after last hiking them to a range of 5.25-5.50% back on July 22nd. It has now been nearly six months since the last rate hike, and December’s Summary of Economic Projections (SEP) released from the FOMC showed expectations for 3-4 rate cuts in 2024. This pivot caused rates to fall sharply, as the market immediately priced in more rate cuts than the Fed projected (at the current juncture about 5-6 cuts).
Bonds posted strong returns across the board as yields fell sharply. Treasury securities, as measured by the Bloomberg Barclays US Government Index gained +4.1% largely from clipping coupons. Corporate bonds, on the other hand, benefitted from both declining rates and tightening credit spreads, with investment grade and high yield corporate bonds gaining +8.5% and +13.5%, respectively. Interestingly, the 10-year Treasury yield ended the year largely where it began, at a yield of 3.88%. Despite that, interest rate volatility soared during the year, with the 2/10 spread largely dis-inverting (to -35bps at year end) as rate cut expectations were priced into the market. Notably, the 10-year Treasury yield rose nearly +100bps in mid-Q4, only to fall more than -100bps into year end.
Even though rates fell sharply into year end, the starting point for investors today (in terms of starting yield) remains incredibly favorable. Rates are near their highest levels in more than a decade, offering investors the opportunity to achieve 4%+ yields to maturity across much of the investable Treasury universe, with higher yields in the corporate bond market due to additional credit spread. Given the attractive fixed income backdrop, it might be time to consider breaking up with nearly 5% cash yields today and starting to plan for the future (i.e. reinvestment risk). With trillions in money market funds, Fed rate cuts could bring a tidal wave of cash into the market, potentially pushing yields lower.
Federal funds rate expectations
FOMC and market expectations for the federal funds rate

Source: JP Morgan Guide to the Markets, December 31, 2023
Looking Forward
While monetary policy is said to act with long and variable lags, we’ve yet to see a significant dent in economic growth. As we look forward into 2024 and beyond, the current economic backdrop is underpinned by three fundamental drivers that remain robust: the labor market, GDP growth, and corporate earnings. Until a “smoking gun” emerges to derail one of the drivers, the market backdrop remains favorable.
- Labor Market: The U.S. economy added +199,000 jobs in December, and the unemployment rate clocked in at 3.7%, marking the 23rd straight month with unemployment at or below 4%. There has never been a recession post-WWII with unemployment below 4%. Wages grew +4.0% Y/Y in December, a sharp slowdown from the +7.0% Y/Y growth rate seen in March 2022, and the +4.7% Y/Y growth rate in June. The number of job openings has fallen by more than 3 million since March 2022, highlighting the fact that corporations have a reduced need for labor. Fewer workers are voluntarily quitting their jobs, and many companies are announcing reductions in their workforces after a significant re-opening period that saw many companies hoard labor. Despite these trends, initial jobless claims, a leading indicator of the health of the labor market, remain near record lows. Taken together, the job market continues to slow, but not at an alarming rate – more of a continuation of the trend that’s been in place since the reopening of the economy post-pandemic.
- GDP Growth: The strength and resilience of the US labor market have propelled consumer spending, which is the bedrock of US GDP. With the consumer representing nearly 70% of the US economy, strength in consumer spending is paramount for economic growth. Consumers continued to spend down savings, while slowing inflation and lower gas prices boosted consumption. According to AAA, the national average for a gallon of gas was $3.09 on January 4th, down more than -5% from a year ago, and nearly -38% from the June 2022 highs near $5/gal. As long as Americans have jobs, they should continue to spend, which is a positive feedback loop for economic growth. Looking at the latest data, growth continued to surprise to the upside in Q4. The US economy expanded +3.1% Y/Y in 2023, and +3.3% annualized rate in Q4. The results stand in contrast to the recession fears from a year ago, and came in ahead of the latest Atlanta Fed GDPNow estimate of +2.4%. Americans continued to spend as consumer sentiment increased, with consumption growing +2.8% in the fourth quarter.
- Corporate Earnings: After multiples compressed in 2022, they vastly expanded in 2023. Earnings growth is expected to be minimal in 2023, with the latest estimates calling for approximately $220 in S&P 500 earnings. Looking forward, however, market expectations are much rosier, calling for double digit growth in both 2024 and 2025, to roughly $245 and $275, respectively, according to Bloomberg. While these estimates will continue to be revised as we move through earnings season and throughout the year, the path of revisions thus far has been higher, not lower. Corporations remain highly profitable, with margins near all-time highs. With recent corporate layoffs and increased productivity, margins may remain elevated or even expand, which would be positive for corporate earnings. As is the case every earnings season, there will be a high degree of scrutiny put on what companies say about the health of the consumer and the forecast for 2024. With the S&P 500 trading north of 20x forward earnings, compared to a 30-year average of 16.6x, an earnings follow through is paramount to justify current equity valuations.
Opportunities Remain Plentiful
While 2023 was a banner year for US equities, it really was a year dominated by the largest companies in the market. As of December 31, the top 10 holdings in the market represented 32.1% of the market capitalization of the S&P 500 – an all-time high. Their forward P/E ratio of 26.9x represents a significant premium to the rest of the market, and to the average stock. Put differently, the “other” 490 stocks in the S&P 500 trade at a forward P/E of 17.1x, which is more in line with historical norms, according to data compiled by JP Morgan. While Mega-Caps have benefitted from size and scale in the AI arms race, they have also grown revenues and earnings at faster clips than the rest of the market, propelling their profitability and earnings contribution to the S&P 500. As of yearend, the Top 10 companies accounted for more than 23% of the last twelve months earnings.
Looking to 2024, opportunities outside of the Top 10 stocks remain abundant. Specifically, our Investment Policy Committee sees opportunity in:
- Small- and Mid-Caps (SMID): Should the economy continue to expand and a soft landing scenario play out as anticipated, SMID-Caps look attractively priced relative to Large-Caps. According to data compiled by Bloomberg, Small- and Mid-Caps traded at 15x forward earnings at year end, well below long-term averages. Should interest rates fall, refinancing and borrowing risks for SMID-caps should also become less of a headwind.
- International Equities: International equities remain fundamentally attractive compared to US equities, and in some cases downright cheap. The MSCI ACWI ex-US Index currently trades at a -34% discount to the S&P 500 expected earnings over the next twelve months, the widest gap in more than 20 years. In addition, the starting dividend yield is more than 1.7% higher than the S&P 500, a statistically significant gap compared to history. Investors are currently being offered more than twice the income (dividends) and the widest discount in over 20 years to invest overseas. Moreover, should the US Dollar weaken, there could be an added boost to total returns from the currency element. Emerging Markets ex-China represents another opportunity to potentially benefit from structural growth drivers in Emerging Markets, without the headwind of China’s heavy hand.
- Income Generators (Both Fixed Income and Equity): With the last rate hike nearly six months ago, it is likely that the highs in rates have been seen, and investors should prepare for rate cuts. Cash returns of 5%+ are unlikely to be attainable much longer (i.e. the 12-month T-Bill already yields less than 5%), and investors should begin to think about repositioning their portfolios. Last July we wrote about Cash as a highly attractive asset class; however, with rate cuts being priced into the market, that may not hold true for much longer. In many cases, repositioning could mean extending duration (lengthening maturities), as we have done this year in each of our strategies. In other cases, it could mean exploring fixed income sectors such as corporate bonds, mortgage backed securities (MBS), or agencies – all areas of increased focus currently.
Equity income replacements such as dividend payers and growers, or defensive sectors that have been out of favor with cash rates near 5% could also be an opportunity. Dividend yields should become more competitive with cash yields as rates come down. Moreover, most dividend related strategies have lagged the market over the past year, meaning investors have not necessarily “missed out”. As the nearby chart highlights, in 5 of the last 6 rate hike cycles, broad based fixed income (Bloomberg US Agg), the equity market (S&P 500), and a balanced (60/40) portfolio all outperformed cash over the subsequent 12 month period. In 6 out of 6 cases, broadening the fixed income horizon proved to outperform cash.
Investment opportunities outside of CDs
Peak 6-month certificate of deposit (CD) rate during previous rate hiking cycles and subsequent 12-month total returns
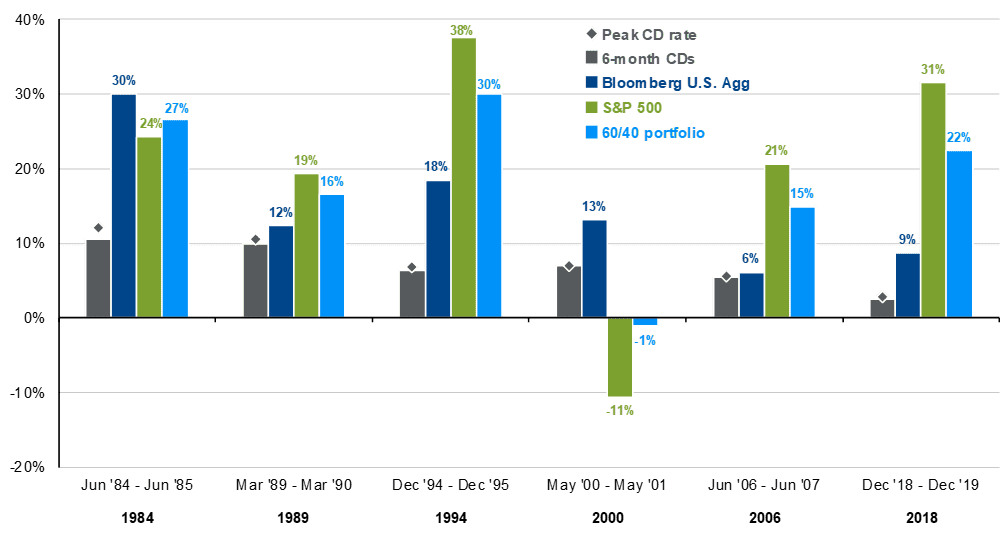
Source: JP Morgan Guide to the Markets, December 31, 2023
Inflation Outlook
Headline inflation continues to fall, coming in at +3.3% Y/Y in December, albeit a tick up from November’s +3.1% Y/Y reading. Core inflation at +3.9% Y/Y remains elevated, although it did move lower when compared to November’s +4.0% reading. Headline inflation would be even lower if owner’s equivalent rent was excluded, emphasizing the need to look through the data to alternative sources of real time indicators (i.e. Zillow). Declining input costs have been seen for three straight months, with the Headline Producer Price Index (PPI) rising +0.9% Y/Y, and Core PPI (ex-Food & Energy) coming in +1.7% Y/Y in December. Lastly, prices paid continued to fall, with the Personal Consumption Expenditures (PCE) price index clocking in at +1.7%, and the Core reading coming in at +2.0%, in line with Fed expectations for long-run inflation targeting, and a multi-year low.
CPI and core CPI
% change vs. prior year, seasonally adjusted
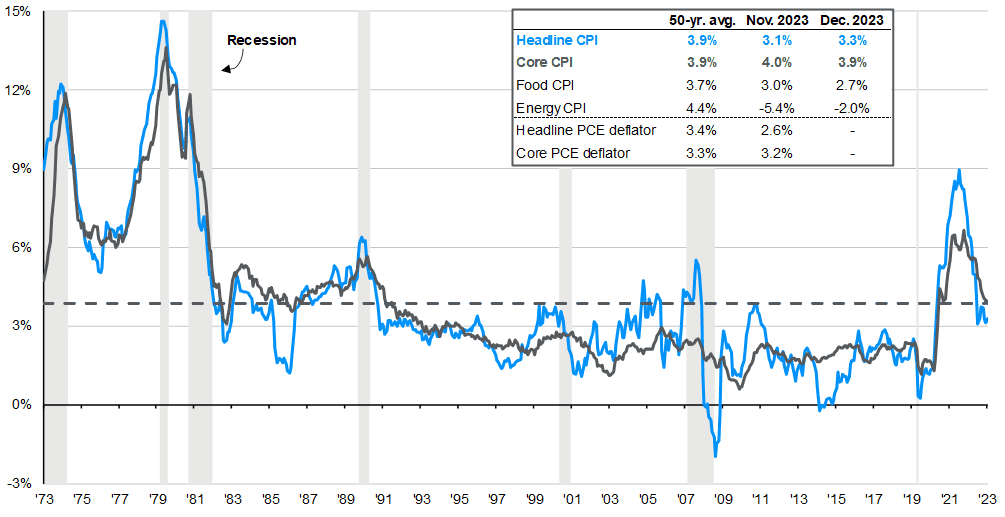
Source: JP Morgan Guide to the Markets, December 31, 2023
With inflation seemingly under control, a healthy labor market should continue to propel consumer spending and economic growth. Taken together, our view remains for a soft landing, but with the caveat that the market has pulled forward a lot of good news. Companies will need to deliver on the bottom line for earnings growth expectations to come to fruition and to justify current valuations. Expectations for the Fed to quickly deliver rate cuts could be met with disappointment, especially after the recent strength demonstrated in Q4 GDP. While the timing is uncertain, rate cuts are likely to be the story of 2024, driving re-allocations of capital across asset classes.
The market remains top heavy, but plenty of opportunities remain underneath the surface, and our Team continues to diligently seek them out. Should we see a broadening out of the market in 2024 (like Q4 of 2023), we could continue to see new highs in the market.
Further out on the horizon, elevated government deficits, an election, and ample geopolitical concerns await. Government deficits in the US are projected to be measured in the trillions for years to come, and the long term implications are uncertain, but bound to be impactful. A continued eye towards risk management, diversification, and proper asset allocation should help weather any storms. Given the elevated levels of income available in the fixed income market today, investors likely can do more (income) with less (volatility), and adjust their asset mixes. The TINA (There Is No Alternative) to stocks trade is over, and investors may not need to take as much equity risk to meet their long-term portfolio objectives.
Thank you for your continued support of Nottingham Advisors and trust in our Team. To dig deeper into our outlook, review asset allocation strategies, or see how we are positioning portfolios for 2024, please give us a call. We would love to hear from you.

Matthew Krajna, CFA
Co-Chief Investment Officer
Matthew joined Nottingham in 2012 and is a member of the Investment Policy Committee. He brings over 13 years of investment experience to the team. Matthew is responsible for conducting investment research, due diligence, and contributing to Nottingham Advisors overall investment strategy. Additionally, He is responsible for establishing the firm’s strategic and tactical asset allocations. Matthew works with investment advisors and both individual clients & institutions to help build customized investment solutions to fit their needs.
Nottingham Advisors offers both institutional and individual clients experience, sophistication, and professionalism when helping them achieve their goals. With over 40 years of serving Western New York and clients in more than 30 states, Nottingham tailors each solution to fit the specific needs of each client.
For more information about Nottingham’s offerings, visit www.nottinghamadvisors.com or call 716-633-3800.
Nottingham Advisors, LLC (“Nottingham”) is an SEC registered investment adviser located in Amherst, New York. Registration does not imply a certain level of skill or training. Nottingham and its representatives are in compliance with the current registration and notice filing requirements imposed upon SEC registered investment advisers by those states in which Nottingham maintains clients. Nottingham may only transact business in those states in which it is registered, notice filed, or qualifies for an exemption or exclusion from registration or notice filing requirements. For information pertaining to the registration status of Nottingham, please contact Nottingham or refer to the Investment Advisor Public Disclosure Website (www.adviserinfo.sec.gov). Any subsequent, direct communication by Nottingham with a prospective client shall be conducted by a representative that is either registered or qualifies for an exemption or exclusion from registration in the state where the prospective client resides.
This newsletter is limited to the dissemination of general information pertaining to Nottingham’s investment advisory services. As such nothing herein should be construed as the provision of personalized investment advice. The information contained herein is based upon certain assumptions, theories and principles that do not completely or accurately reflect your specific circumstances. Information presented herein is subject to change without notice and should not be considered as a solicitation to buy or sell any security. Adhering to the assumptions, theories and principles serving the basis for the information contained herein should not be interpreted to provide a guarantee of future performance or a guarantee of achieving overall financial objectives. As investment returns, inflation, taxes and other economic conditions vary, your actual results may vary significantly. Furthermore, this newsletter contains certain forward-looking statements that indicate future possibilities. Due to known and unknown risks, other uncertainties and factors, actual results may differ materially from the expectations portrayed in such forward-looking statements. Readers are cautioned not to place undue reliance on forward-looking statements, which speak only as of their dates. As such, there is no guarantee that the views and opinions expressed in this article will come to pass. This newsletter should not be construed to limit or otherwise restrict Nottingham’s investment decisions.
This newsletter contains information derived from third party sources. Although we believe these third party sources to be reliable, we make no representations as to the accuracy or completeness of any information prepared by any unaffiliated third party incorporated herein, and take no responsibility therefore. Some portions of this newsletter include the use of charts or graphs. These are intended as visual aids only, and in no way should any client or prospective client interpret these visual aids as a method by which investment decisions should be made. We have provided performance results of certain market indices for illustrative purposes only as it is not possible to directly invest in an index. Indices are unmanaged, hypothetical vehicles that serve as market indicators and do not account for the deduction of management fees or transaction costs generally associated with investable products, which otherwise have the effect of reducing the performance of an actual investment portfolio. It should not be assumed that your account performance or the volatility of any securities held in your account will correspond directly to any benchmark index. A description of each index is available from us upon request.
Investing in the stock market involves gains and losses and may not be suitable for all investors. Past performance is no guarantee of future results.
For additional information about Nottingham, including fees and services, send for our Disclosure Brochure, Part 2A or Wrap Brochure, Part 2A Appendix 1 of our Form ADV using the contact information herein.